LocalEthereum usage statistics: trades and disputes
In the last few years, of a lot of people learned about cryptocurrencies. Some of them decided to put their money into crypto assets: Bitcoin, Ethereum, tokens, collectibles, and more. The reasons vary: speculation, hedging traditional securities, or just getting something to play with. The demand generated gigantic profits for exchanges and allowed many new players to join.
Cryptocurrency exchanges
Let’s start by breaking down existing solutions. The most popular way to buy crypto today is Coinbase ↗. It is simple, fast, and convenient. Yet, Coinbase is centralized. Moreover, instead of trading with other people, you trade with Coinbase. That means that Coinbase defines the buy and sell price rates. While it might be close to the market price, you have no other option but to accept it.
LocalBitcoin ↗ (LB) is an example of peer-to-peer marketplace. On LB you trade not with the company that runs the service, but with other people, or peers. That comes at a cost of usability. Each time you want to buy bitcoin, you need to go to the site, browse through offers filtering unrelated ones, pick the trader, negotiate with him, make a bank transfer, wait until he receives the funds, then wait again until he releases bitcoins. That’s nowhere near Coinbase’s “one-click buy”. Therefore, LB and other peer-to-peer exchanges are mostly adopted in countries where Coinbase is simply not available.
Finally, let’s talk about LocalEthereum ↗ (LE). How it’s different from LB? First, LB allows you to buy bitcoin, while LE is focused on ether. Second, LE is based on a smart contract that works as an escrow, and LB operates completely off-chain. Third, LE is a non-custodial exchange while LB keeps your bitcoin just like any other centralized exchange.
On-chain data
Given that LocalEthereum runs on-chain, we can go through the transactions to gather the data about usage of the exchange. The usual way to gather dapp usage statistics is to go through contract events. In LE, however, all events have only one parameter — trade hash — which doesn’t provide a lot of information. Therefore, we’ll need to look at transactions, parse input data and look at transactions of interest.
To start, we’ll need a contract address. Etherscan kindly tell us that the current LocalEthereum address is 0x867f…ae06 ↗. We can see that this contract was deployed in June 2018. However, I know that LE was launched in 2017, so there must be another contract. And there is. It was a bit tricky to find it because Etherscan doesn’t show the second contract in search results, but I found the address in one of the blog posts ↗. Its address is 0x0967…Ae5d ↗. Therefore, we need to aggregate transactions from both contracts. Hopefully, their functionality and ABI are similar.
As far as I know, the contract was changed to support login via web3 wallets ↗ like Metamask and imToken. Michael from LE team sheds light on that:
“The only real change was that we started to use the Ethereum wallet signature prefix for user-signed messages (i.e. “\x19Ethereum Signed Message:\n”). This was necessary in order to enable our external wallet integration.”
Getting the data through Google BigQuery
I use Google BigQuery to extract the data from the blockchain. The syntax is pretty trivial, as I simply collected all transactions that went into any of the two LE contracts.
SELECT
  *
FROM
  `bigquery-public-data.ethereum_blockchain.transactions`
WHERE
  to_address = '0x867ffb5a3871b500f65bdfafe0136f9667deae06'
  OR to_address = '0x09678741bd50c3e74301f38fbd0136307099ae5d'
Export that data to CSV, and now we have a file with all transactions that happened on LocalEthereum.
Contract ABI
Let’s look at the contract’s interface. As I said, we can’t use events because they don’t reveal any information besides the trade hash, so we’ll go through all transactions, looking for successful trades.
We need to learn a bit more about how p2p exchanges work. During an exchange, one of the sides can try to cheat by not sending the money. Of course, the other side needs some protection. Therefore, crypto is usually held in escrow. Once the seller of crypto is happy with the fiat he received, he can release funds. Only then the buyer will be able to use them.
What does it mean for us? For each trade, there are at least two transactions: seller sending funds to escrow, and buyer taking them. In other words, we can’t know for sure whether the trade will finalize based on the first transaction. Therefore, we’ll use the second one. Looking at the contract and how it’s used, seems like batchRelay is exactly what we need. It takes trade ID, buyer address, seller address, ether value, fee, trader signature, and /instruction byte/. The instruction byte can take an integer number from 1 to 6, stating the result of the trade. We’re interested in number 5, or INSTRUCTION_RELEASE. This tells us that the seller is releasing funds, or, in other words, trade is successfully completed.
Open trades
To keep it simple, let’s start with counting opened trades and their total volume. All trades on LE are created via issuing createEscrow transaction. In total, there were 108,535 such transactions. The volume of those transactions is 103,889 ether. That gives us 0.957 ether as an average trade value.
Finished trades
Now, let’s get the finished trades. As I said before, we need to look at batchRelay transactions with instruction byte equal to 5. Additionally, we need to look at the release transactions, which do the same.
There were 95,466 finished trades with the total volume of 88,458.5 ether. In average, finished trade value is 0.926 ether.
We’re going to look at finished trades more closely. Let’s aggregate trades by day. Also, I calculated trade volume in USD using a price of ETH pulled from CoinGecko API ↗. Finally, I built some charts showing daily volume in both ether and dollars.
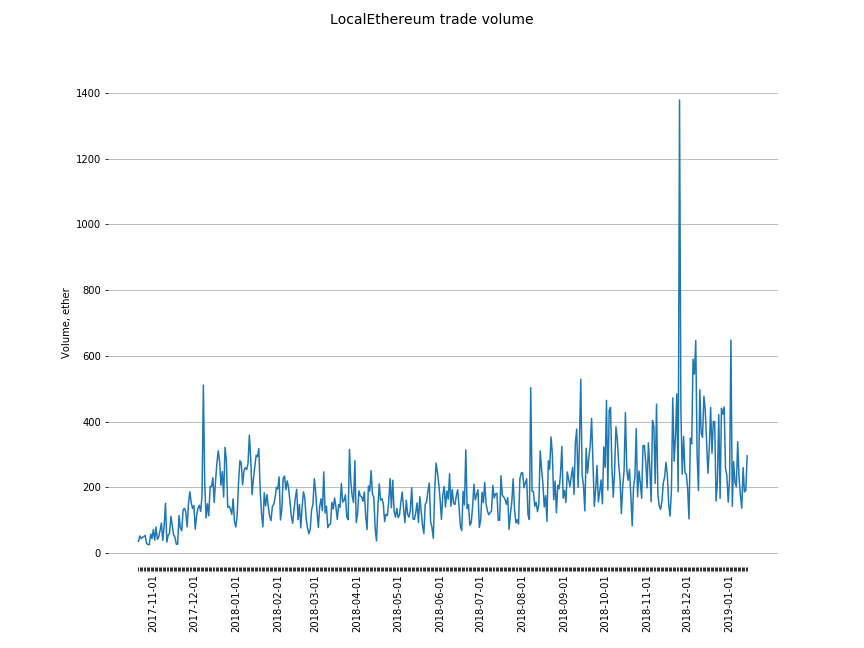
We can see that ETH volume quickly grew from the beginning, decreased a bit after the market crashed, and since then slowly grew, which it does still.
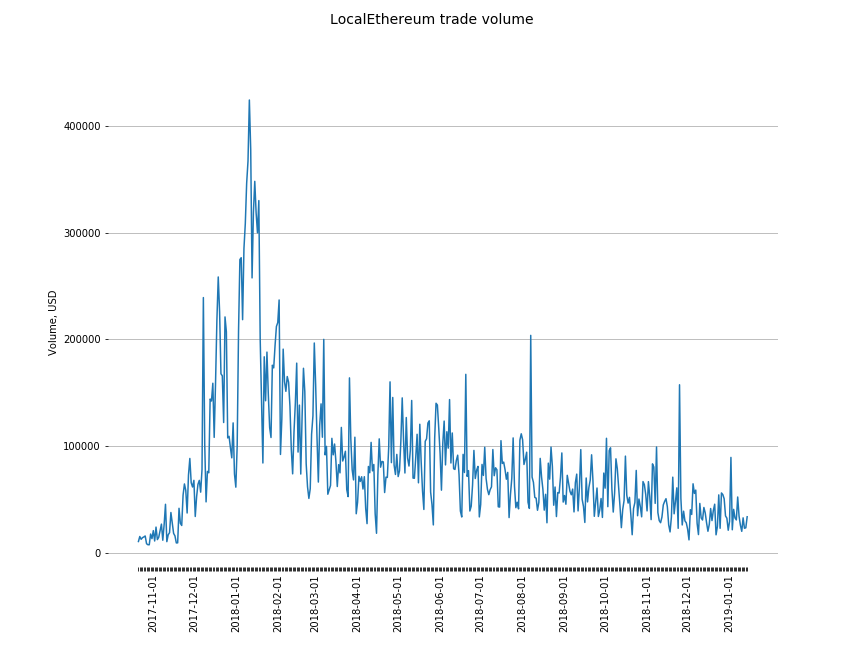
USD volume chart is a bit depressing. We can see a crazy spike during the 2017/2018 crash, and since then the volume was decreasing. As expected, the volume chart correlates with the price of ether.
Disputes
In total, there were 777 disputes. Total ether volume of those disputes is 1,557. From that 1,557 ether, buyers received 104 ether (6.7%) and sellers received 1,453 ether (93.3%), which means that most of the disputes resolved in the favor of ether sellers. Average dispute size is about 2 ether.
Let’s build the same chart as we did for finished trades.
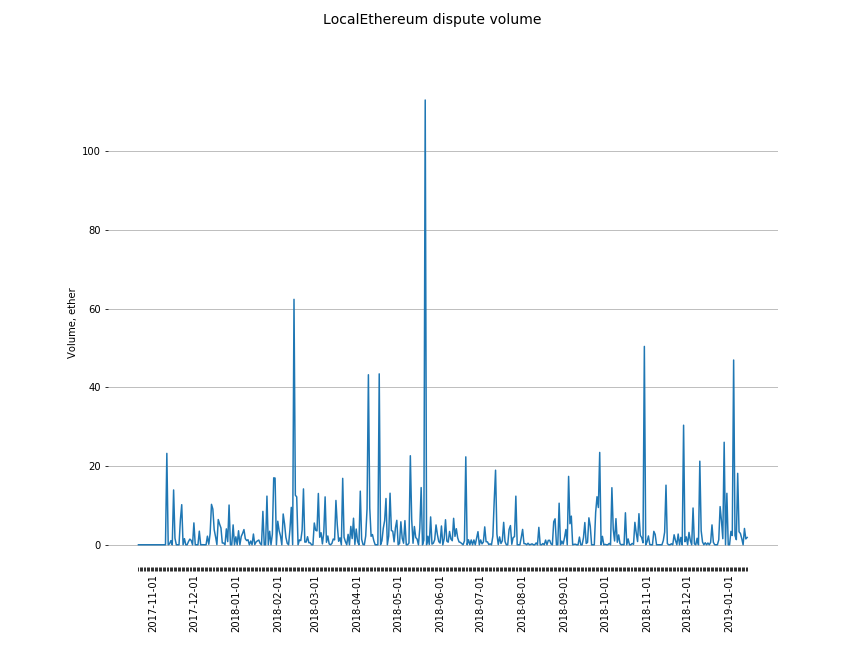
Here’s the dispute volume by day. We see a few outliers here and there, but nothing particularly of interest. It’s hard to see whether there’s some trend, so let’s calculate what /share/ disputes take in the daily volume of open trades.
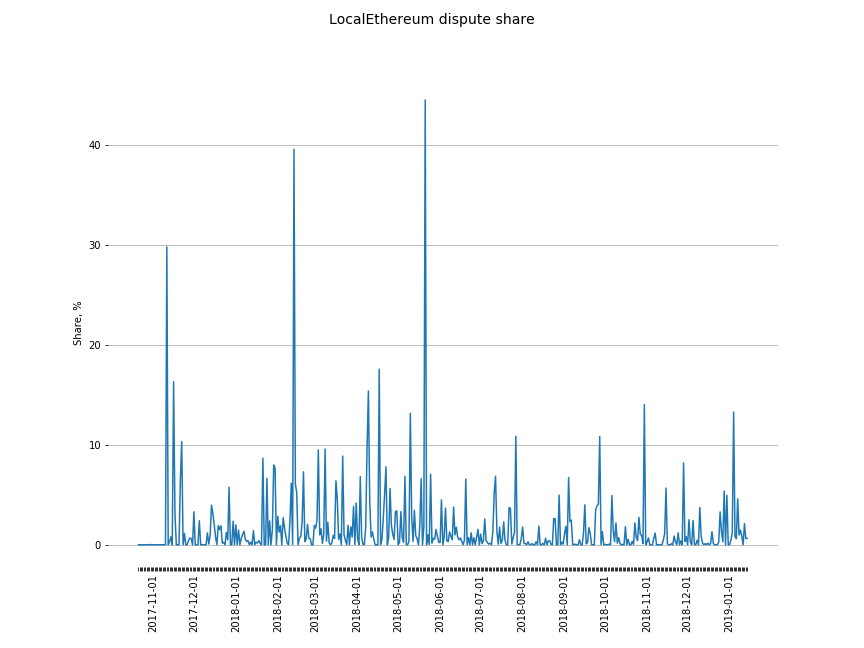
Again, a few spikes that probably represent a single dispute with a large volume. However, we can clearly see a significant decrease in dispute share in the summer of 2018. It looks like the relative volume of dispute decreases.
Finally, let’s look at the rate of /number/ of disputes compared to opened trades.
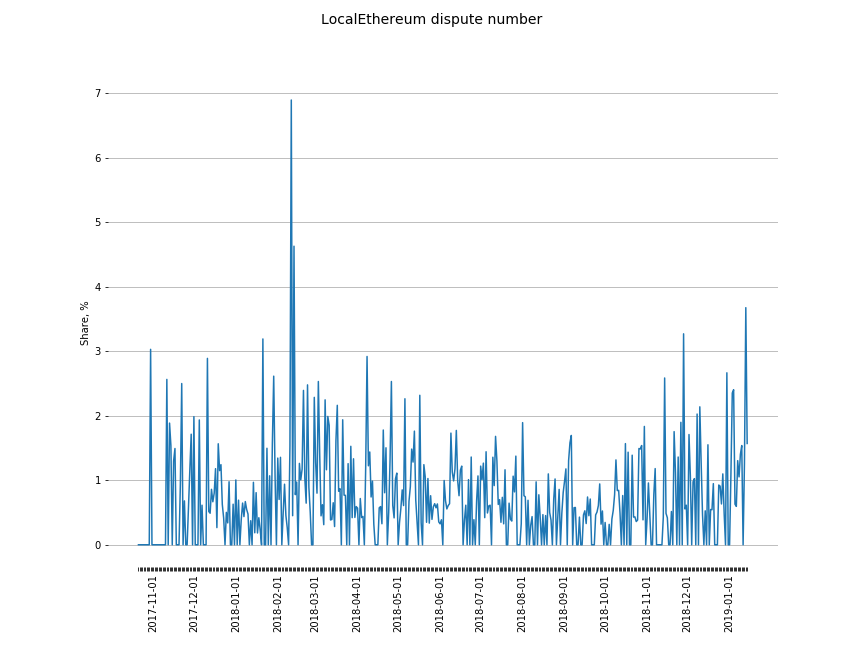
Looks like the number of disputes relative to the number of all trades was pretty stable despite the recent decrease in dispute volume. Indeed, most of the spikes on the dispute volume chart are just a few disputes with a large size.
Off-chain data
Michael generously shared some statistics on usage in different countries. He provided monthly data for the 3 biggest currencies in terms of the number of trades and volume.
I excluded some countries from the charts to make it simple. I also unified VES and VEF, bolívar soberano and bolívar fuerte, for the same reason.
First, let’s look at the trade count chart.
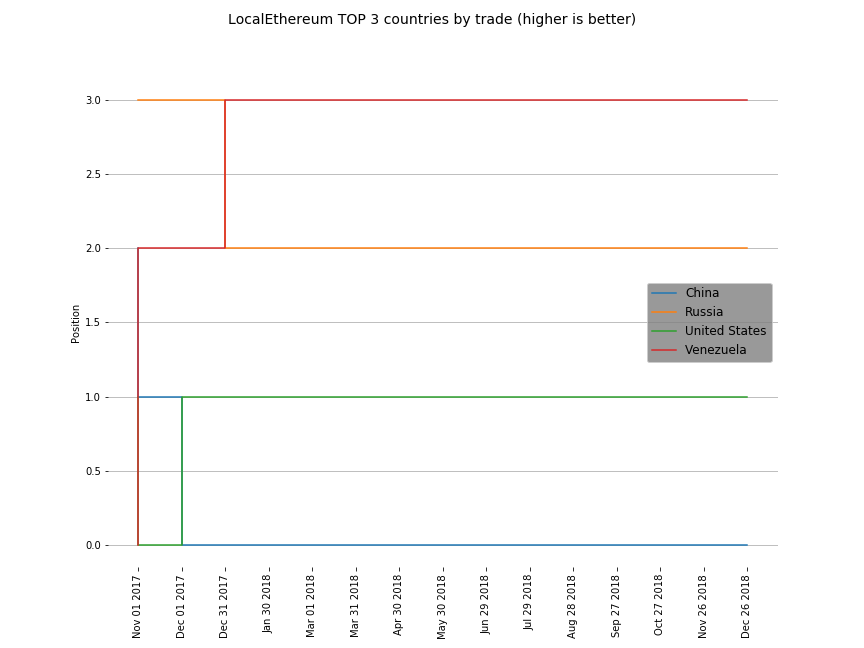
The chart looks surprisingly stable. Basically, Venezuela, Russia, and the United States took the first three spots.
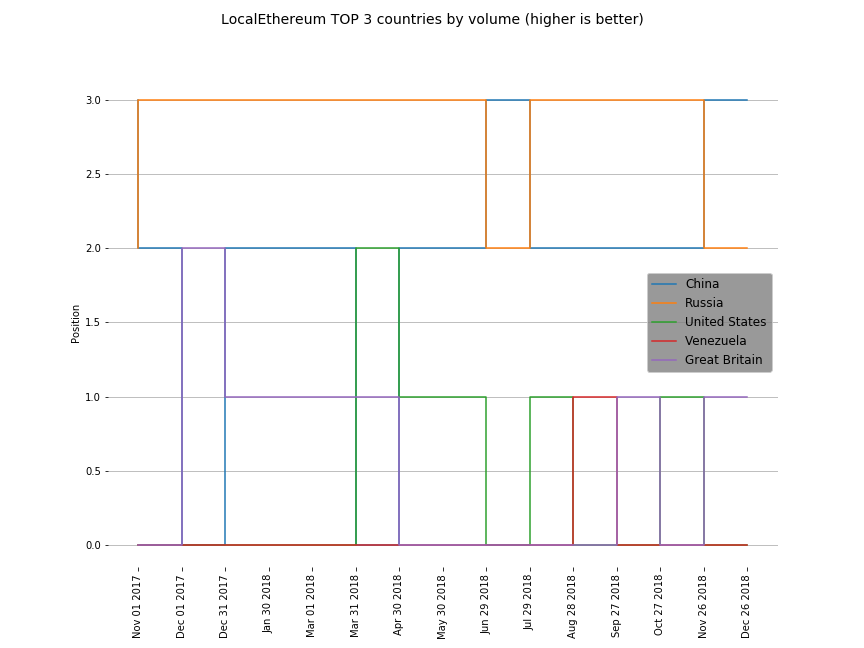
The volume chart looks much messier. The countries are mostly the same (with the addition of Great Britain), but their positions vary significantly month to month. Russia is in the first place, and China takes the second one most of the time. Third place is taken by different countries in different months.
Conclusion
Peer-to-peer crypto marketplaces prosper. The daily volume on LocalEthereum goes in tens of thousands of dollars. The average number of trades is about 200. The number of disputes overall seems to be low.
As expected, the biggest adopters of p2p exchanges are residents of countries where the demand of crypto as a protection against the high volatility of local currency is high and the supply of centralized solutions is low. Nevertheless, countries where Coinbase and other centralized exchanges exist still take a significant part in trade volume.
What is the future of peer-to-peer crypto exchanges? Will centralized solutions eventually capture developing markets to meet the demand? My guess is that Coinbase and others will go in most of the countries, but the demand for peer-to-peer exchanges of fiat into crypto will stay, as the marketplaces themselves. It might be a niche market, but a market indeed.